Atmosphere’s Gases
Table 5.2 lists the twelve most common gases in the Earth's lower atmosphere. Of the gases listed, nitrogen, oxygen, carbon dioxide, methane, nitrous oxide, and ozone are vital to the health of the Earth's biosphere. The table indicates that nitrogen and oxygen are the main components of the dry atmosphere by volume. These two gases comprise approximately 99% of the dry atmosphere (Figure 5.1). Both of these gases have significant associations with life. Nitrogen gas (N2) is removed from the atmosphere and deposited on Earth’s surface primarily by specialized bacteria that can fix nitrogen gas, and through lightning and associated precipitation. The addition of nitrogen to Earth’s surface soils and various water bodies provides essential nutrients for plant growth. Nitrogen returns to the atmosphere mainly through natural processes such as biomass burning and denitrification.
Oxygen (O2) is exchanged between the atmosphere and biosphere through photosynthesis and respiration. Photosynthesis produces oxygen when carbon dioxide and water are chemically converted into glucose in chloroplasts with the help of sunlight. Respiration is the reverse of photosynthesis. During respiration, oxygen combines with glucose to release energy for metabolism. The products of this reaction are water and carbon dioxide. Respiration and photosynthesis work in tandem to maintain a steady state of oxygen in the atmosphere.
The fourth most abundant gas in the atmosphere is carbon dioxide. Carbon dioxide (CO2) is exchanged between the atmosphere and life through photosynthesis and respiration. The volume of this greenhouse gas has increased by about 53% in the last three hundred years (Figure 5.2). This increase is primarily due to human activities that burn fossil fuels for energy and heat,deforestation, and other forms of land-use modification. Scientists believe this increase is intensifying the greenhouse effect and global warming. The greenhouse effect is a natural process that provides additional heat energy to the Earth’s ground surface and lower atmosphere. This extra heat is produced when the various greenhouse gases absorb and reemit outgoing longwave radiation from the Earth.
Before 1700, atmospheric carbon dioxide levels were about 280 ppm (parts per million). The concentration of carbon dioxide is now (December 2025) about 427.5 ppm (Figure 5.2) as measured at Mauna Loa, Hawaii. This increase in carboas measured at Mauna Loa, Hawaii. This increase in atmospheric carbon dioxide is primarily due to human activities. Societal changes caused by the Industrial Revolution increased the amount of carbon dioxide entering the atmosphere. Emissions from the combustion of fossil fuels account for about 65% of the additional carbon dioxide found in the atmosphere. The remaining 35% is derived from deforestation and the conversion of prairie, woodland, and forested ecosystems primarily into less productive agricultural systems. Natural ecosystems can store 20 to 100 times more carbon dioxide per unit area than agricultural systems. Both deforestation and natural land-use change reduce the amount of standing plant mass or biomass found on the Earth’s surface. This reduction causes a net export of carbon stored in biomass into the atmosphere through decomposition and burning.
Since 1750, the atmospheric concentration of the greenhouse gas methane (CH4) has increased by more than 150% (Figure 5.3). The primary sources for the additional methane added to the atmosphere (in order of importance) are rice cultivation, domestic grazing animals, termites, landfills, oil and gas extraction, and coal mining. The anaerobic conditions associated with rice paddy flooding result in the formation of methane gas (Figure 5.4). An accurate estimate of how much methane is produced from rice paddies has been difficult to determine. More than 60% of all rice paddies are found in India and China, where scientific data concerning emission rates are hard to obtain. Nevertheless, scientists believe that rice paddies make a significant contribution because this type of crop production has more than doubled since 1950. Grazing animals release methane into the environment as a result of herbaceous digestion. Some researchers believe the addition of methane from this source has more than quadrupled over the last century. Termites also release methane through the digestion of plant material. Land-use change in the tropics, driven by deforestation, ranching, and farming, may be causing termite numbers to increase. These types of land conversion produce an environment favorable for termites. Landfills produce methane as organic wastes decompose. Coal, oil, and natural gas deposits release methane into the atmosphere when these deposits are excavated or drilled.
The average atmospheric nitrous oxide (N2O) concentration is now increasing at 0.2 to 0.3% per year (Figure 5.5). Nitrous oxide is another greenhouse gas. Its contribution to the greenhouse effect is minor relative to the other greenhouse gases already discussed. Nitrous oxide also contributes to the artificial fertilization of ecosystems. In extreme cases, this fertilization can lead to the death of forests, eutrophication of aquatic habitats, and species die-offs. Sources for the increase of nitrous oxide in the atmosphere include land-use conversion, fossil fuel combustion, biomass burning, and soil fertilization. Most of the nitrous oxide added to the atmosphere each year comes from deforestation and the conversion of forest, savanna, and grassland ecosystems into agricultural fields and rangelands. Both processes reduce the amount of nitrogen stored in living vegetation and soil by decomposing organic matter. Nitrous oxide is also released into the atmosphere when fossil fuels and biomass are burned. Using nitrate and ammonium fertilizers to enhance plant growth is another important source of nitrous oxide. How much is released from this process has been challenging to quantify. Some estimates suggest that fertilizers may account for as much as 50% of the nitrous oxide emitted into the atmosphere annually.
Areas of high ozone gas (O3) concentration are found in two regions of Earth's atmosphere. Most of the ozone (about 97%) in the atmosphere is concentrated in the stratosphere at altitudes of 10 to 50 km (6 to 31 mi) above the Earth's surface. This stratospheric ozone provides an essential service to life on Earth by absorbing harmful ultraviolet radiation. In recent years, levels of stratospheric ozone have decreased due to the buildup of artificially produced chlorofluorocarbons (CFCs) in the atmosphere. Since the late 1970s, scientists have noticed a seasonal ozone depletion in the stratosphere over Antarctica. Satellite measurements have also indicated that the zone between 65°N and 65°S has seen a 3-4% decrease in stratospheric ozone since 1978. Ozone is also highly concentrated at the Earth's surface, particularly in and around cities. Most of this ozone is created as a byproduct of human-created photochemical smog. This buildup of ozone is toxic to organisms.
Water vapor was excluded from the gases listed in Table 5.2 because its concentration varies dramatically in the lower atmosphere, both spatially and temporally. Two main reasons for these variations are: warmer air has more internal energy, increasing the evaporation of liquid water into vapor, and air over water bodies receives more moisture from evaporation than air over relatively dry continental masses. Consequently, the highest concentrations of water vapor are found near the equator over the oceans and the humid tropical rainforests. Cold polar areas and subtropical continental deserts are regions where the water vapor volume can reach 0%. Water vapor has several essential environmental functions:
- It redistributes heat energy on the Earth through latent heat energy exchange.
- The condensation of water vapor creates precipitation that falls to the Earth's surface, providing much-needed fresh water for plant and animal consumption.
- It helps warm the Earth's atmosphere through the greenhouse effect.
Aerosols
The atmosphere contains a variety of liquid droplets and solid particles, collectively known asaerosols. Both natural and human processes produce these substances. Water droplets and ice crystals are natural aerosols quite familiar to us. We see large accumulations of these particles in clouds almost every day. Other types of natural aerosols include wind-blown soil particles, volcanic dust, pollen, smoke and soot particles from wildfires, and salts from sea spray (Figure 5.6). Aerosols of human origin mainly consist of dust hurled into the atmosphere by vehicles and agricultural activities, smoke and soot from the burning of vegetation, and emissions from the combustion of fossil fuels.
The size of aerosols ranges from readily visible particles to specks of matter as small as 0.2 µm (micrometers). Smaller aerosols can remain floating in the atmosphere for long periods due to the slightest vertical air motions. Larger particles tend to fall out of the atmosphere hours or minutes after being lifted. Most aerosols are suspended in the atmosphere for a few days to several weeks. Precipitation is extremely efficient at removing particles from the atmosphere in two ways. Aerosols act as the nucleus of developing raindrops and snow crystals. Furthermore, falling rain droplets and snow crystals capture many particles by collision during their path to the ground surface.
Aerosol concentrations vary in the atmosphere both spatially and temporally. Some temporal variations are associated with daily or seasonal changes in wind speed. Daily, the wind typically has a lower velocity during the night. Maximum wind speeds often occur in the afternoon. Spatially, aerosols are most numerous over cities, seacoasts, and over areas of non-vegetated soil. The barren deserts of the world produce large quantities of wind-blown particles (Figure 5.6). Concentrations also tend to be greater in the lower atmosphere because air density increases as you approach the Earth’s ground surface. Higher air densities make aerosols more buoyant.
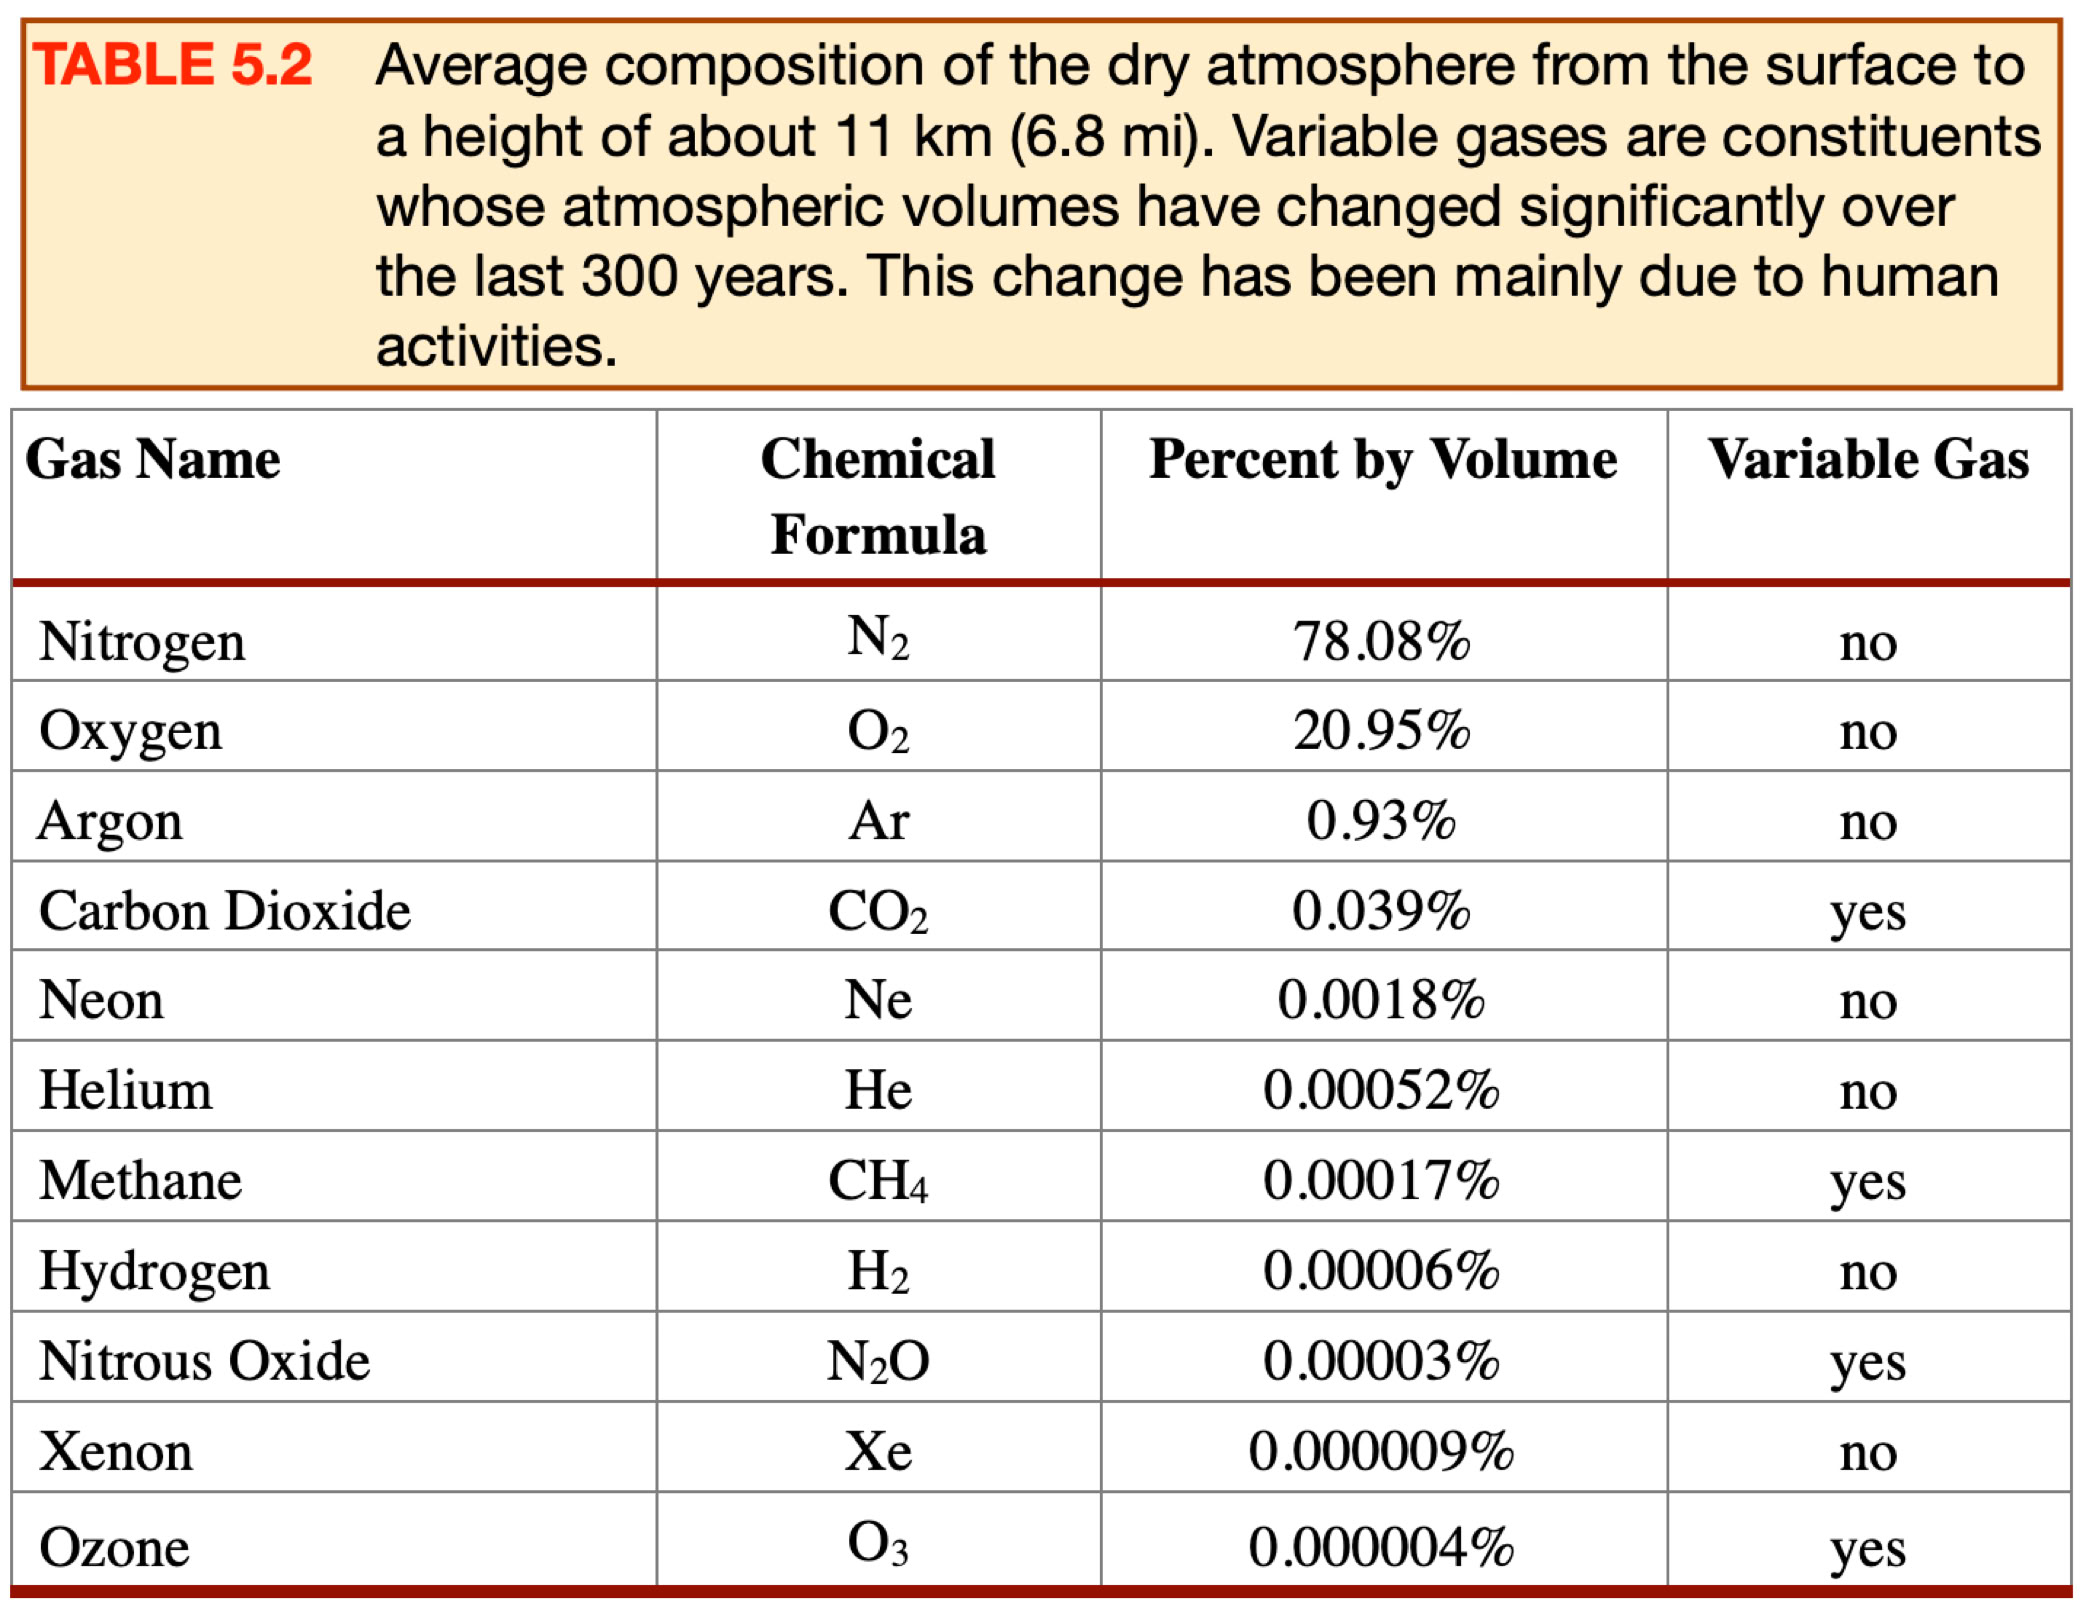

FIGURE 5.1 Proportional concentration of the gases found in the lower atmosphere. By volume, nitrogen and oxygen are the most common gases. Image Copyright: Michael Pidwirny.
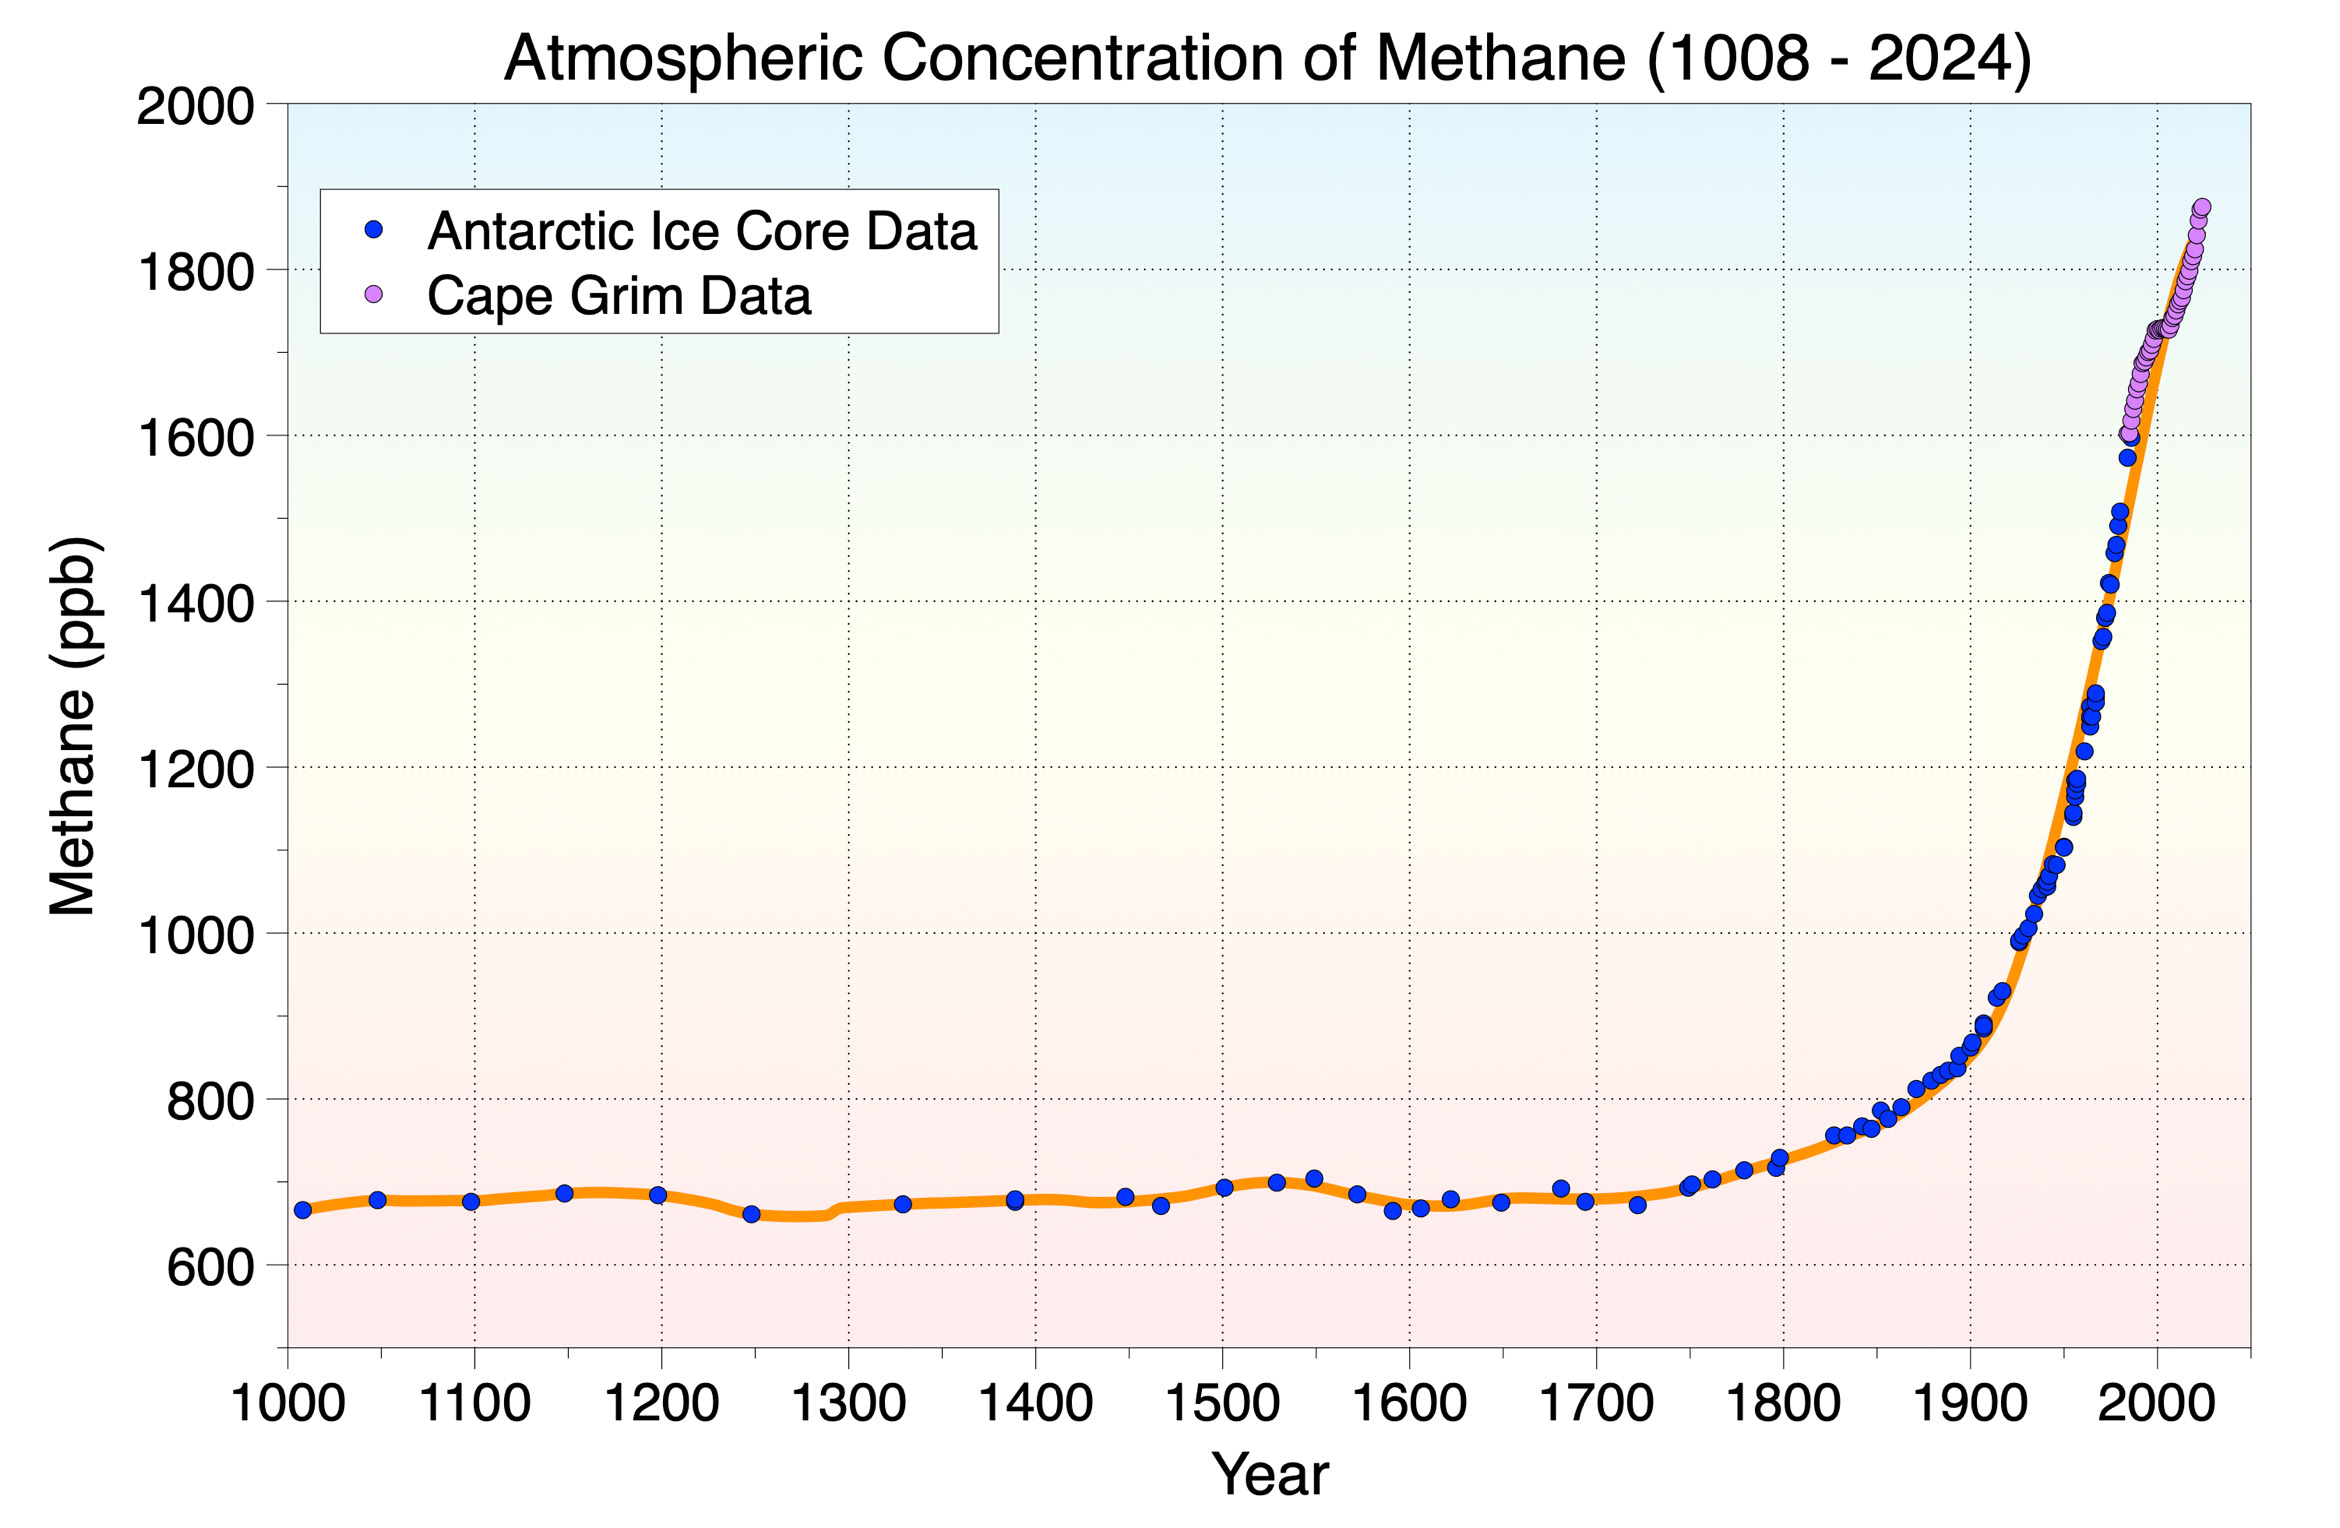

FIGURE 5.4 Rice paddies are a major source of methane added to the atmosphere over the last 200 years. Shown are farmers planting rice in Gebangsari Village, Banyumas, central Java, Indonesia. Image Source: Wikimedia Commons.

FIGURE 5.5 The following graph illustrates the rise in atmospheric nitrous oxide from 1978 to 2024. This increase is almost linear. An extrapolation into the immediate future would suggest continued annual increases. Image Copyright: Michael Pidwirny. Data Source: National Oceanic and Atmospheric Administration's (NOAA) Climate Monitoring and Diagnostics Laboratory, http://www.esrl.noaa.gov/gmd/hats/combined/N2O.html.
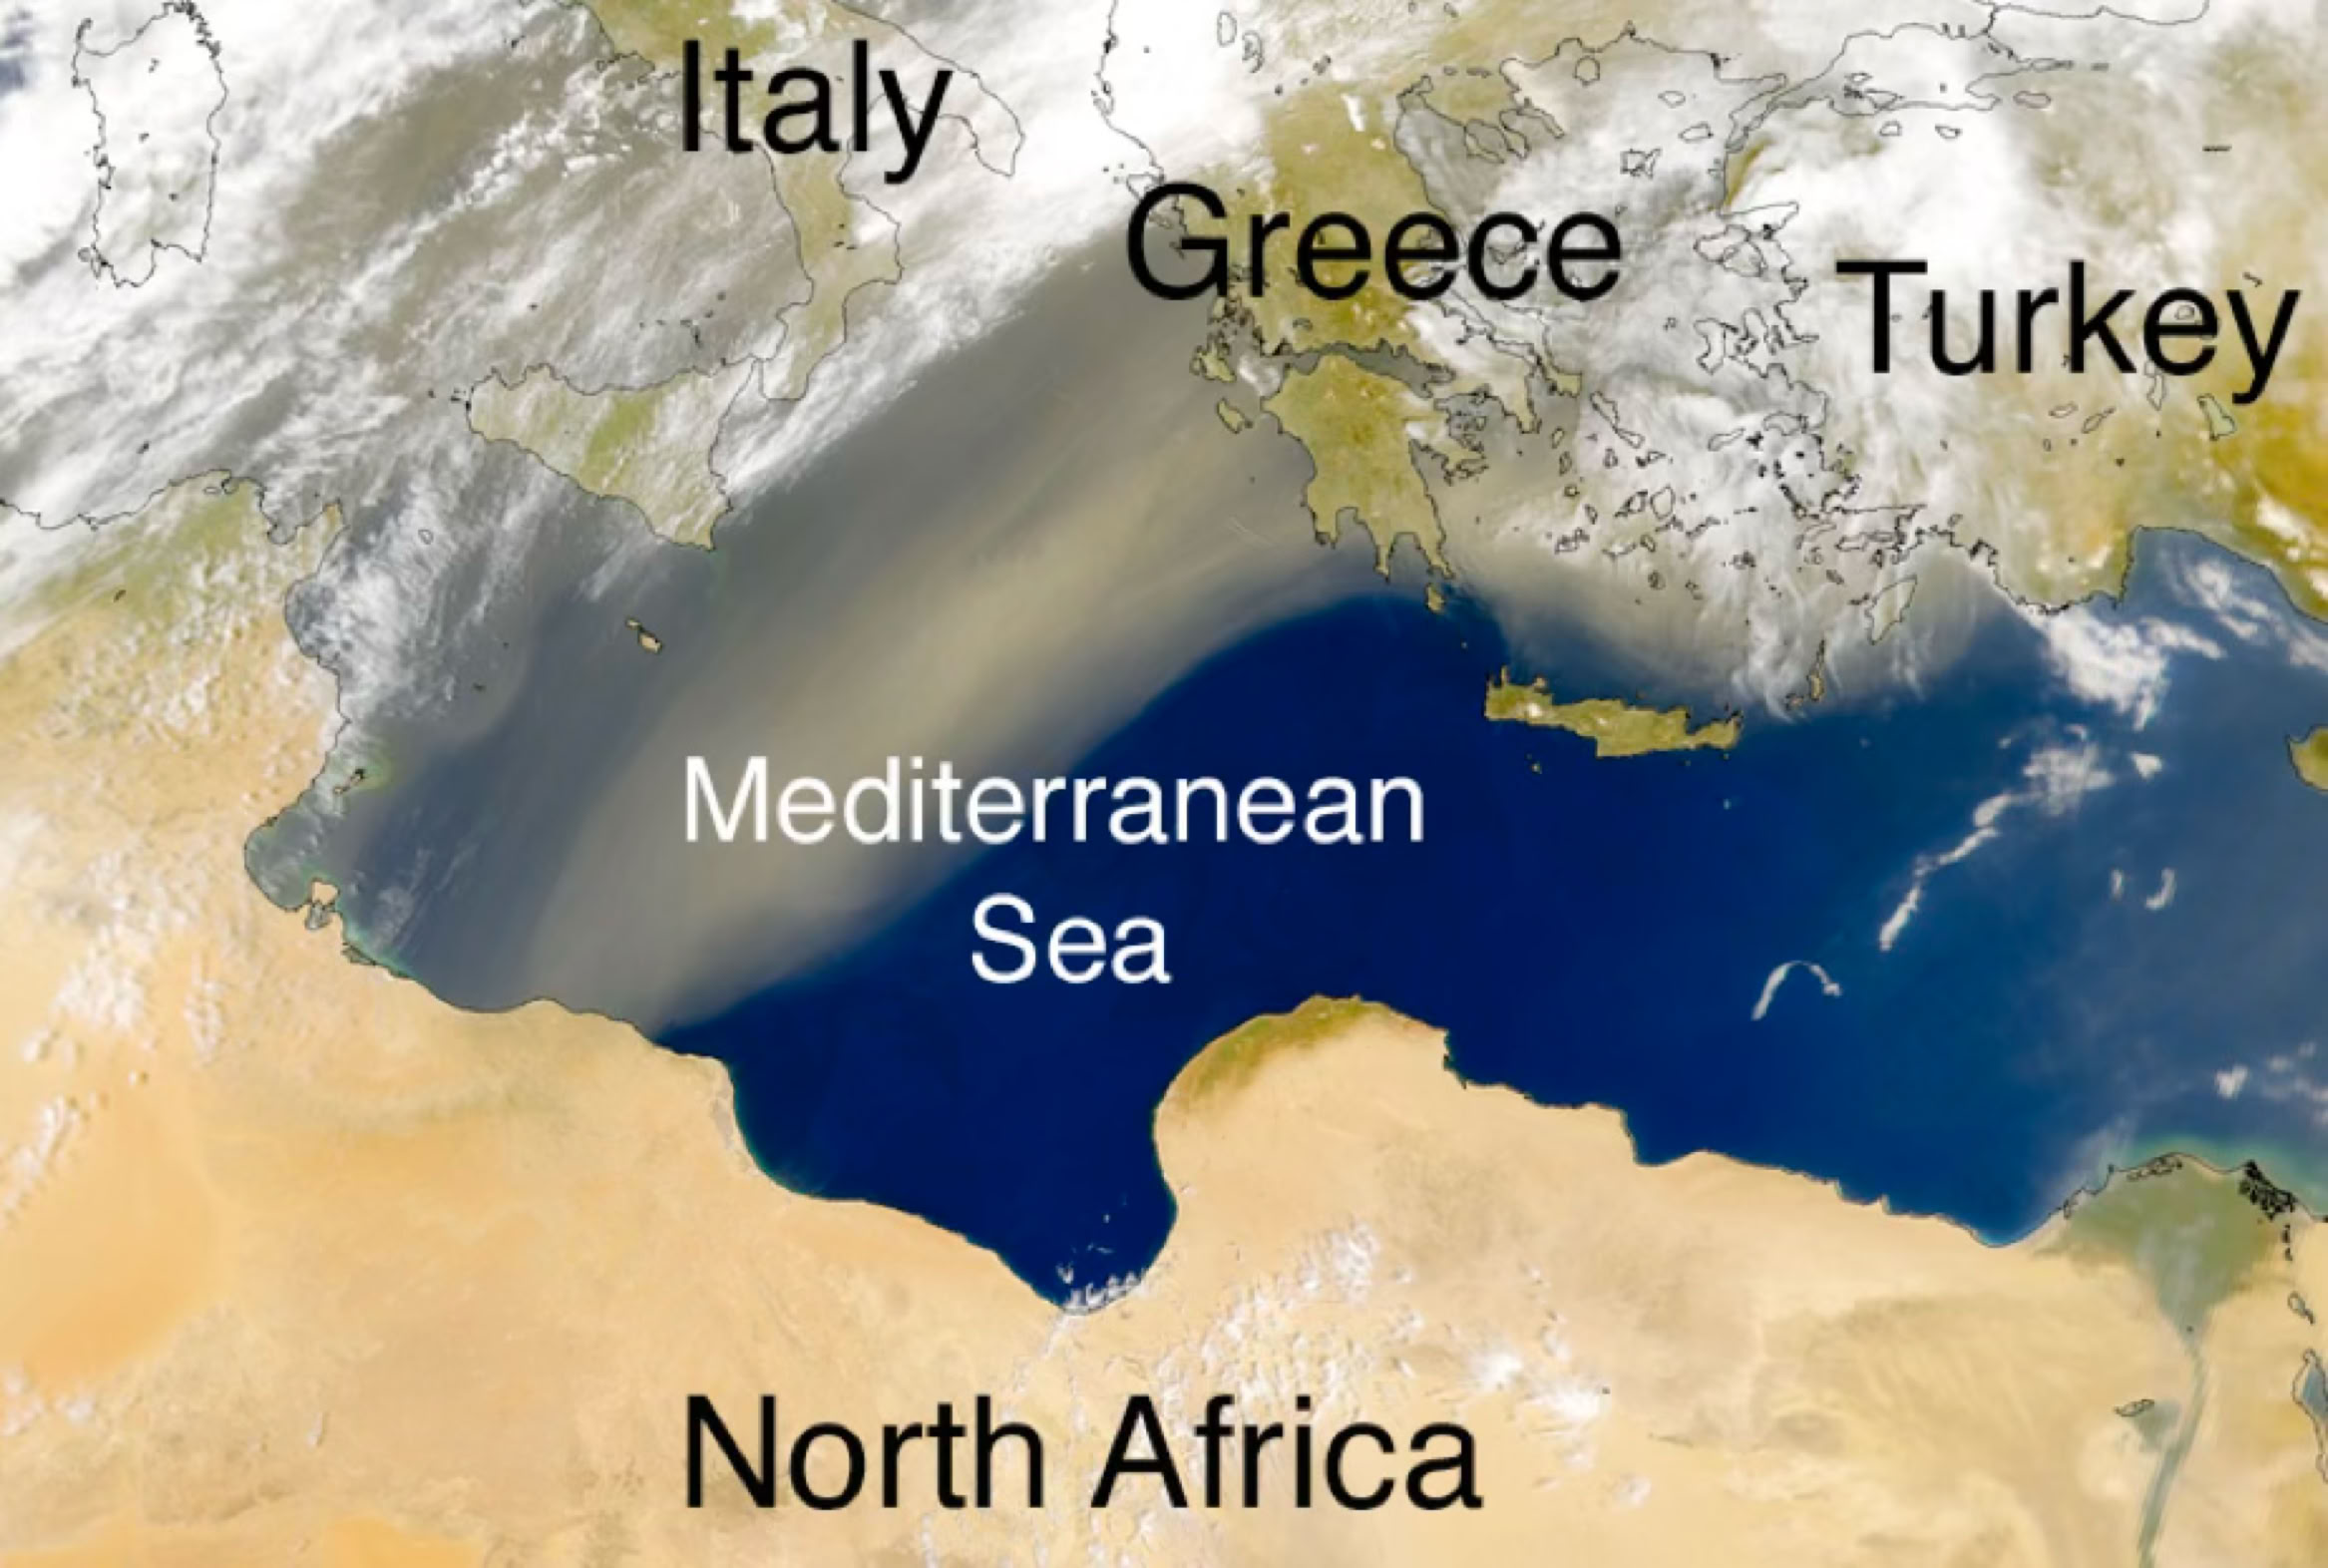
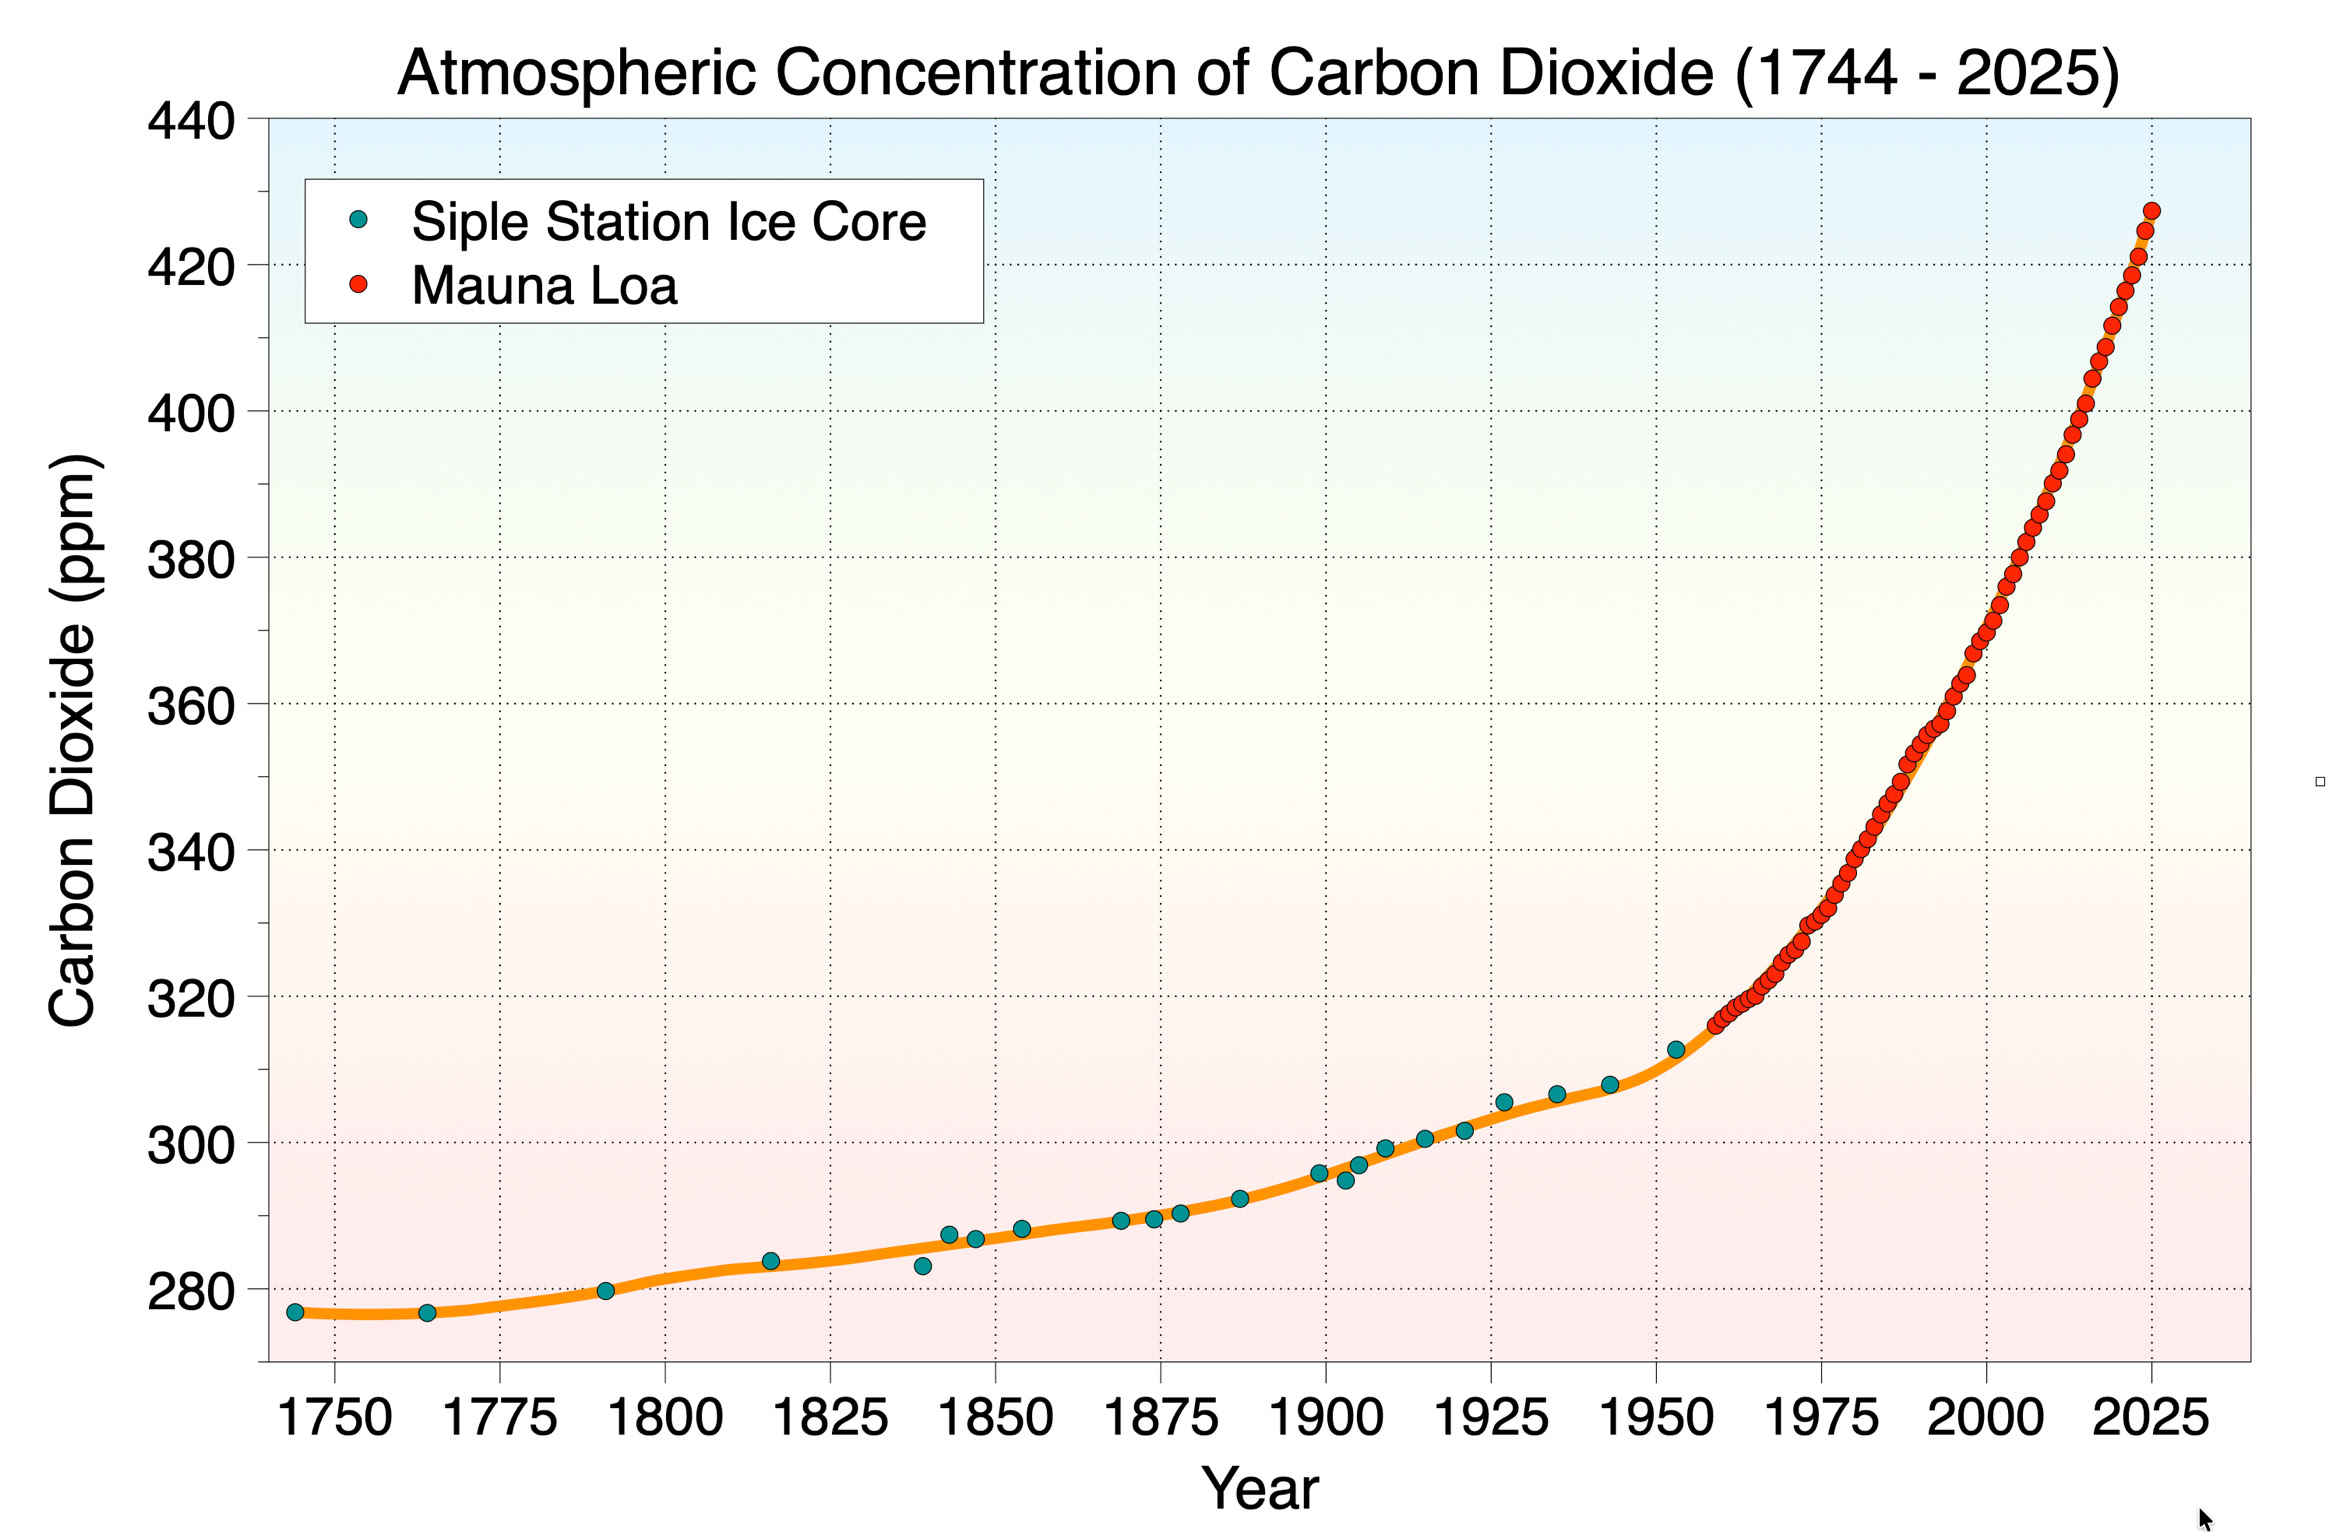
FIGURE 5.2 The following graph illustrates the rise in atmospheric carbon dioxide from 1744 to 2025 as measured from the Siple Station, Antarctica, and Mauna Loa, Hawaii. Note that the increase in atmospheric carbon dioxide concentration is exponential. An extrapolation into the immediate future would suggest continued annual increases. Image Copyright: Michael Pidwirny. Data Source: Neftel, A., et al. 1994. Historical carbon dioxide record from the Siple Station ice core. pp. 11-14. In T.A. Boden, D.P. Kaiser, R.J. Sepanski, and F.W. Stoss (eds.) Trends'93: A Compendium of Data on Global Change. ORNL/CDIAC-65. Carbon Dioxide Information Analysis Center, Oak Ridge National Laboratory, Oak Ridge, Tenn., USA, and Dr. Pieter Tans, NOAA/ESRL (http:// www.esrl.noaa.gov/gmd/ccgg/trends/) and Dr. Ralph Keeling, Scripps Institution of Oceanography (http://scrippsco2.ucsd.edu/).
FIGURE 5.3 The following graph illustrates the rise in atmospheric methane from 1008 to 2024. Note that the increase in atmospheric methane concentration is exponential. An extrapolation into the immediate future would suggest continued annual increases. Image Copyright: Michael Pidwirny. Data Source: D.M. Etheridge, L.P. Steele, R.J. Francey, and R.L. Langenfelds. 2002. Historical CH4 Records Since About 1000 A.D. From Ice Core Data. In Trends: A Compendium of Data on Global Change. Carbon Dioxide Information Analysis Center, Oak Ridge National Laboratory, U.S. Department of Energy, Oak Ridge, Tenn., USA. and NOAA Earth System Research Laboratory, Trends in Atmospheric Methane, http://www.esrl.noaa.gov/gmd/ccgg/trends_ch4/.
FIGURE 5.6 Large quantities of dust moved from Northern Africa to Southern Europe on March 26, 2001. This image, obtained by the SeaWiFS sensor aboard the OrbView-2 satellite, shows that Greece is receiving some of the heaviest concentrations of that dust. Image Source: NASA - Earth Observatory.