FIGURE 7.3 Increasing or decreasing the temperature of a gas while holding volume constant causes proportional changes in the pressure exerted by a gas. The length of the trailing blue streaks indicates the relative speed of the moving gas molecules. Image Copyright: Michael Pidwirny.
An extensive layer of gases, minute liquid droplets, and tiny solid particles that constitute the atmosphere lies above Earth's ocean and land surfaces. All these atmospheric substances are forms of matter and therefore exhibit the properties of mass and weight. We can define mass as the amount of matter in an object. Obviously, an equal volume of our planet's atmosphere and the materials found beneath the ground (soil and rocks) do not have the same mass. As a rule of thumb, liquids have less mass than solids, and gases have less mass than liquids
Weight can be defined as a measure of the gravitational force acting on an object. Gravity is a force that is found in all things that have mass. The strength of this force is related to the size of an object's mass. The more mass an object has, the greater its gravitational force will be. The strength of this force is also influenced by distance, decreasing as one moves farther from the object's center. As a result, the strength of the gravitational attraction between any two objects in our Universe is determined by the mass of the objects and the spatial distance that separates them.
The solid portion of the Earth has many times more mass than the atmosphere. Consequently, the atmosphere is pulled toward our planet's surface with great force. According to the previous discussion, the measurement of this force would be equal to the weight of the atmosphere's mass. This weight is routinely measured and is called atmospheric pressure. Near-surface atmospheric pressure measurements are made at meteorological stations worldwide several times daily. Some of these stations also regularly measure vertical atmospheric pressure using an electronic device attached to a balloon called a radiosonde (which also measures temperature and humidity). Measurements from the radiosonde are transmitted to a ground-based receiving station until the balloon expands to the point that it pops. This balloon explosion typically occurs at an altitude of about 30 km (19 mi). Near-surface and upper-air measurements are used to help construct future weather forecasts for our planet.
Atmospheric pressure varies both vertically and horizontally in our atmosphere. Several factors are responsible for this fact. Most variations in atmospheric pressure are caused by changes in the mass of the overlying atmosphere. Changes in atmospheric mass at the local or regional scale can occur due to air movement driven by atmospheric circulation (Figure 7.1). An increase in atmospheric pressure occurs when air collects in a particular location. Decreases in air pressure can arise when circulation removes air from an area.
Another factor that can alter atmospheric pressure is the air's moisture concentration. The molecular weight of water vapor (H2O) is actually less than that of the other two main constituents of the atmosphere, oxygen (O2) and nitrogen (N2). Consequently, increasing the concentration of water vapor in a volume of air decreases atmospheric pressure. Note that this fact contradicts the popular belief that humid air is heavier than dry air.
Pressure, Density, Volume, and Temperature
Changes in atmospheric pressure can also be caused by changes in air temperature, volume, and density. The connection between these variables and air pressure can be expressed mathematically. This mathematical relationship is known as the Ideal Gas Law. Two equations are commonly used to describe this law:
Pressure x Volume = Constant x Temperature
and
Pressure = Density x Constant x Temperature
The equations shown define the following relationships between pressure, density, temperature, and volume. When temperature is held constant, increasing the volume occupied by the atmosphere's gases causes the air's density and pressure to decrease, while decreasing the volume results in an increase in both density and pressure (Figure 7.2). If the volume is kept constant, the pressure of a unit mass of the atmosphere is proportional to temperature. Consequently, an increase in temperature will cause pressure to rise, and a decrease in temperature will cause pressure to drop (Figure 7.3). Keeping pressure constant causes the temperature of a gas to be proportional to volume and inversely proportional to density. Thus, increasing the temperature of a unit mass of the atmosphere causes its volume to expand and its density to decrease. In contrast, a drop in temperature causes volume to decrease and density to rise (Figure 7.4).
Surface Atmospheric Pressure
Figure 7.5 shows the average change in atmospheric pressure with height above the ground surface. This figure shows that as one moves from Earth's surface towards the edge of the atmosphere, atmospheric pressure declines rapidly with altitude. At the Earth's surface, pressure averages about 1013.2 millibars (mb) or 29.92 inches (in) of mercury. Both of these units are commonly used in the United States for quantifying atmospheric pressure. Scientists favor the metric unit, the Pascal (Pa), for measuring pressure. One millibar is equal to 100 pascals. Meteorologists in countries that use the metric system of measurements (like Canada) often use multiples of the Pascal unit, known as kilopascals (kPa). The prefix kilo means 1000. Consequently, 1 kilopascal is the same as 1000 Pa or 10 mb. Another unit of force sometimes used by scientists to measure atmospheric pressure is the Newton (N). One millibar equals 100 Newtons per square meter (N/m2 or N m-2).
Variations in air pressure near the Earth’s surface normally fall in a range from 970 to 1050 mb (Figure 7.6). Measurements in the upper half of this range (1010 to 1050 mb) are normally associated with clear skies, a dry atmosphere, and fair or cold weather. Pressure readings in the lower half of this range (970 to 1010 mb) are often related to cloudy skies, a moist atmosphere, and stormy weather. Air pressure values near the Earth's surface can occasionally fall outside the normal range just mentioned. For example, some tropical storms, known as hurricanes, can create localized areas of extremely low pressure. Hurricane Tip, which formed in the western Pacific Ocean in October 1979, was estimated to have a central pressure reading of 870 mb. This reading stands as the lowest pressure ever measured at the surface of our planet. The highest recorded surface pressure was measured in Agata, Siberia, in December 1968, at 1084 mb. This event was caused by an extremely cold and dry air mass that dominated Siberia on this date.
Measuring Air Pressure
Any instrument that measures air pressure is called a barometer. The first measurement of atmospheric pressure began with a simple experiment by Evangelista Torricelli in 1643. In this experiment, Torricelli immersed a sealed tube in a container of mercury. Atmospheric pressure then forced the mercury up the tube to a level considerably higher than that in the container (Figure 7.7). Torricelli determined from this experiment that the atmospheric pressure was about 30 in or 76 cm (1 cm of mercury is equal to 13.3 mb). Evangelista also noticed that the height of the mercury varied with changes in outside weather.
The most common type of barometer used in homes is the aneroid barometer (Figure 7.8). The fundamental design of this weather instrument was devised in the 1700s but was not perfected sufficiently to construct an operational device until the mid-19th century. Inside this instrument is a small, flexible metal capsule called an aneroid cell. In the construction of the device, a partial vacuum is created inside the capsule so that small changes in outside air pressure cause the capsule to expand or contract. The size of the aneroid cell is then calibrated, and any change in its volume is transmitted via springs and levers to an indicating arm that points to the corresponding atmospheric pressure on an indicator display.
A barograph is a modified aneroid barometer that continuously records air pressure changes over time (Figure 7.8). In this device, the aneroid cell is mechanically linked to a recording pen that produces a continuous record of pressure change over time on a calibrated paper chart. The recording chart, known as a barogram, is positioned on a rotating drum that is gradually rotated by a clock mechanism.
Weather Maps and Air Pressure
Atmospheric pressure readings routinely taken at meteorological stations worldwide are used to construct surface weather maps. This information is shown on these maps using a system of lines called isobars. Isobars are lines connecting points on the map with the same atmospheric pressure (Figure 7.9). Isobars are normally drawn on weather maps at standard intervals of 4 mb (996, 1000, 1004, etc.). It is common for these isobars to form an arrangement consisting of several enclosed isobars, one inside the other. The centers of such patterns indicate the locations of either high or low pressure centers on the map. Lows can be identified by the fact that the pressure readings on enclosed isobars decrease as the center of the pattern is approached. Centers of high pressure exhibit the opposite tendency: the isobars become steeper as you move inward.
The isobars on surface weather maps are based on measurements reduced to sea level. Air pressure readings are regularly adjusted to sea level pressure at weather stations worldwide. Essentially, this adjustment removes the influence of elevation from the measurement. For example, the readings at a location with an elevation of 1000 m (3280 ft) would have 114.4 mb added to them to obtain an equivalent sea level pressure.
Global Atmospheric Pressure Patterns
Figure 7.10 describes typical patterns of sea level pressure for the Earth's surface for January and July. During January, areas of high pressure develop over central Asia (Siberian High), off the coast of California (Hawaiian High), central North America (Canadian High), over Spain and northwest Africa, extending into the subtropical North Atlantic (Azores High), and over the oceans in the Southern Hemisphere at the subtropics. Areas of low pressure occur just south of the Aleutian Islands (Aleutian Low) and just below the southeastern tip of Greenland (Iceland Low). We also have a continuous band of low pressure that circles the planet along the coast of Antarctica (60 to 80° South).
During July, several dominant winter pressure systems disappear. Gone is the Siberian High over central Asia and the dominant low-pressure systems near the Aleutian Islands and at the southeastern tip of Greenland. The Hawaiian and Azores High intensify, increase in size, and shift northward in their relative ocean basins. High pressure systems over the subtropical oceans in Southern Hemisphere also strengthen, enlarge, and move northward. Areas of dominant high pressure develop over Australia and intensify over Antarctica (South Polar High). Regions of low pressure form over the Middle East, southwest Asia (Asiatic Low), and southern Mongolia. These three low pressure systems are responsible for the summer monsoon rains of Asia. The belt of low pressure along the coast of Antarctica becomes slightly less intense.
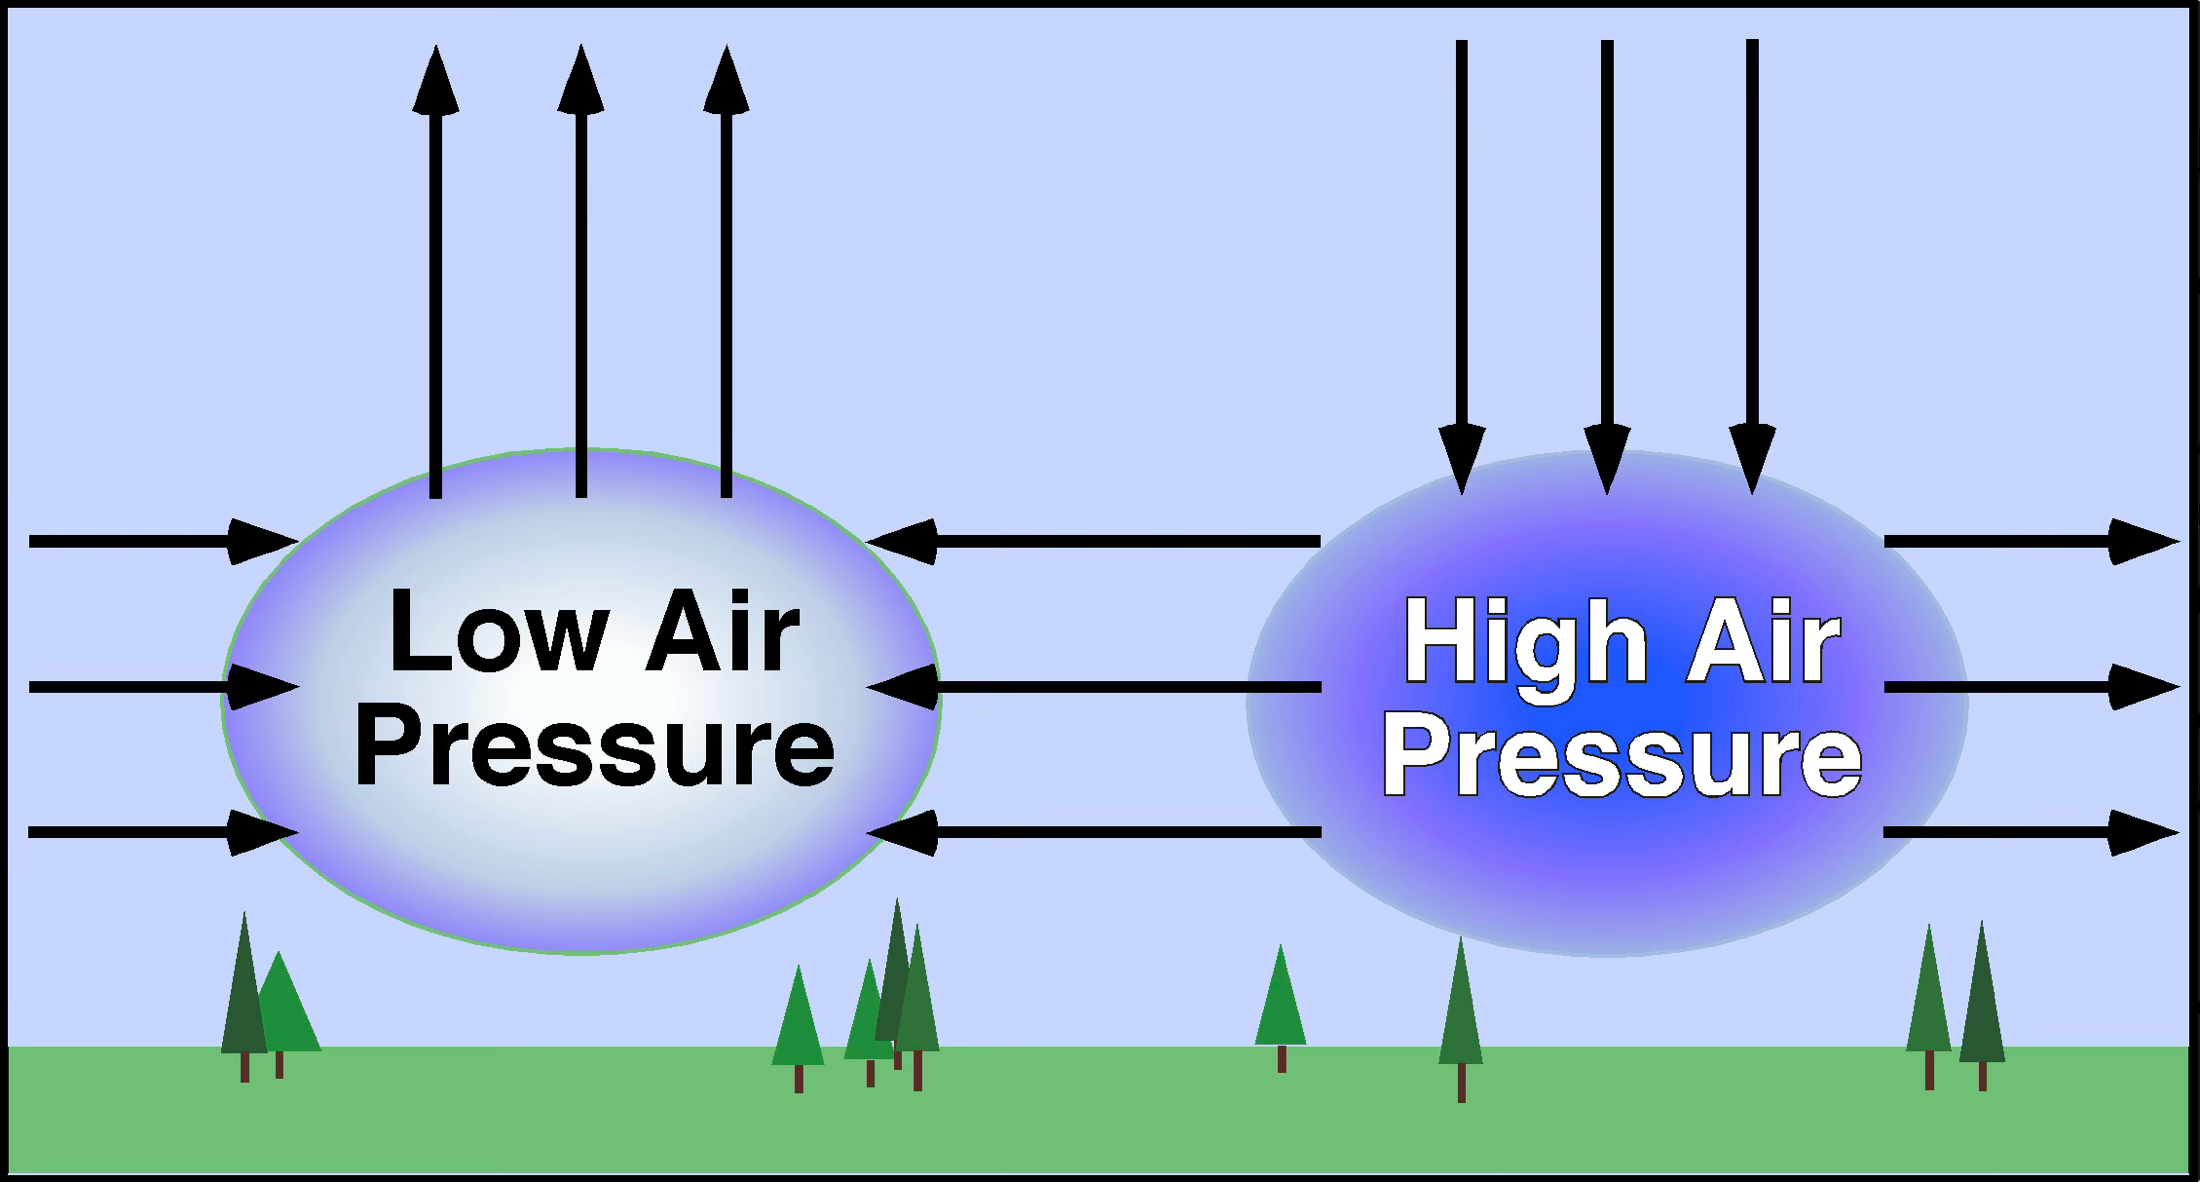
FIGURE 7.1 Variations in atmospheric pressure can occur because of air circulation. In the illustration above, air movement out of a region in the atmosphere causes air pressure to drop. An increase in atmospheric pressure occurs when circulation patterns cause air to accumulate in a specific area. Image Copyright: Michael Pidwirny.

FIGURE 7.2 Increasing or decreasing the volume occupied by a gas while holding temperature constant causes proportional changes in the density and pressure exerted by a gas. Image Copyright: Michael Pidwirny.


FIGURE 7.4 Increasing or decreasing the temperature of a gas while holding pressure constant causes proportional changes in the density and volume of space occupied by a gas. The length of the trailing blue streaks indicates the relative speed of the moving gas molecules. Image Copyright: Michael Pidwirny.

FIGURE 7.5 Change in average atmospheric pressure with altitude. Note that the average atmospheric pressure at sea level is 1013.2 mb or 101.32 kPa or 29.92 in. Image Copyright: Michael Pidwirny.

FIGURE 7.6 Sea level variations and extremes in atmospheric pressure in millibars and inches of mercury. Image Copyright: Michael Pidwirny.

FIGURE 7.7 Evangelista Torricelli invented the first barometer by immersing a sealed tube in a container of mercury. Pressure from the weight of the overlying atmosphere forced the mercury to rise from the container into the tube to a height of about 30 in (76 cm). Image Copyright: Michael Pidwirny.

FIGURE 7.8 (A) Aneroid barometer measuring air pressure in inches and centimeters. (B) Barograph used to obtain continuous records of air pressure change. Image Source A: Wikipedia, Image Source B: Wikipedia.

FIGURE 7.9 Weather map depiction of surface air pressure as measured in millibars (mb). Weather maps use isobars to connect points of equal atmospheric pressure. The interval between isobars shown here is 4 mb. This weather map also indicates low (L) and high pressure (H) centers. Image Copyright: Michael Pidwirny.


FIGURE 7.10 January and July average sea level pressure and major low and high pressure centers on the Earth's surface as determined from 50 years of climate records (1951-2000). Atmospheric pressure values are adjusted for elevation and are described relative to sea level. Original Image Source: Climate Reanalyzer (https://climatereanalyzer.org), Climate Change Institute, University of Maine, USA. The dataset used for these maps is NOAA 20th Century Reanalysis Version 2.